ガンマ関数
通常の階乗は整数のみだが、ガンマ関数は、小数点や複素数などの階乗でも求めることができる。\(\displaystyle \gamma \)がガンマ関数のことを表し、\(\displaystyle \int_0^\infty \)はリーマン積分を表している。また、複素数には実数部と虚数部があり\(\displaystyle 5 + 3j \)の場合、\(\displaystyle j \)が付いている方を虚数部(この場合だと\(\displaystyle 3j \))と言い、付いていない方を実数部(この場合だと\(\displaystyle 5 \))と言う。また、\(\displaystyle \Re_z \)はこの複素数の実数部を表す。
ガンマ関数(1) : \(\displaystyle \gamma(n) = (n – 1)! \)
ガンマ関数(2) : \(\displaystyle \gamma(z) = \int_0^\infty t^{z-1} e^{-t} dt( \Re_z > 0) \)
\(\displaystyle \sim \)は、ニアリーイコールを表している。
スターリング近似 : \(\displaystyle \gamma(z) \sim \sqrt\frac{2\pi}{z} (\frac{z}{e}) \)
Pythonでガンマ関数を求める
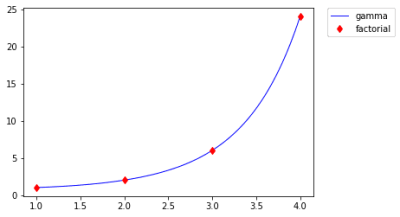
まず、ガンマ関数と通常の階乗をグラフにして確認してみる。ガンマ関数は、\(\displaystyle n – 1 \)の階乗を取るため、ガンマ関数の方の\(\displaystyle n \)には、\(\displaystyle n + 1 \)とし、通常の階乗の結果に合わせる。また、ガンマ関数はscipyのspecial.gamma関数で実装できる。
ガンマ関数(1) : \(\displaystyle \gamma(n) = (n – 1)! \)
通常の階乗 : \(\displaystyle n! \)
import math
import numpy as np
from matplotlib import pylab as plt
from scipy.special import gamma

n = 1
n_1 = n + 1

gamma_y = np.linspace(n_1, 5, 100)
plt.plot(gamma_y - 1, gamma(gamma_y).real, linewidth=1, alpha=1, color='b', label='gamma')

factorial_y = range(n, 5)
plt.plot(factorial_y, [math.factorial(i) for i in factorial_y], marker='d', color='r', linestyle="None", label='factorial')
plt.legend(bbox_to_anchor=(1.05, 1), loc=2, borderaxespad=0.)
青色の直線がガンマ関数、赤色のダイヤが通常の階乗の結果ですが、一致していることがわかる。つまり、ガンマ関数は通常の階乗も普通に計算できる。
次にもう一個の式を実装し、ガンマ関数に4を入れて求めてみる。4なので、\(\displaystyle (4 – 1)! = 3 \times 2 \times 1 \times = 6 \)となるはず。
ガンマ関数(2) : \(\displaystyle \gamma(z) = \int_0^\infty t^{z-1} e^{-t} dt( \Re_z > 0) \)
def gamma_func(z):
    # sigma
    sum = 0
    # dt
    t = np.linspace(0, 10000, 10000)

    for i in range(len(t) - 1):
      # t^z-1 * e^-t * dt
      sum += (t[i] ** (z - 1)) * (math.e ** -t[i])* (t[i + 1] - t[i])

    return sum

result = gamma_func(4)
print(result)6.006515068931777ちゃんと6に近い結果が得られた。
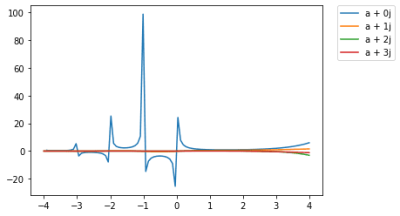
また、\(\displaystyle \Re_z > 0 \)は、正の数しか取り扱うことができないということ。そこで、負の数を入れてグラフにしてみる。
import numpy as np
from matplotlib import pylab as plt
from scipy.special import gamma

a = np.linspace(-4, 4, 100)

for i in range(4):
  # complex型は複素数用の型
  plt.plot(a, gamma([complex(r, i) for r in a]).real, label='a + {0}j'.format(i))

plt.legend(bbox_to_anchor=(1.05, 1), loc=2, borderaxespad=0.)
0より左側、つまり実数部の値が負の数を取る場合、不規則な値になっていることがわかる。
また、リーマン積分に関してはscipyのintegrate関数を利用すると精度が上がる。
import math
import numpy as np
import pandas as pd
from scipy import integrate

def gamma_func(z, t):
    # t^(z-1) e^(-t)
    return (t ** (z - 1)) * (math.e ** -t)

idx = []
data = []

for z in range(4, 11):
  idx.append(z)
  result, err = integrate.quad(lambda t: gamma_func(z, t), 0, 10000)
  data.append(result)

print(pd.DataFrame(data, index=idx, columns=['result']))| factorial | result |
|---|---|
| 4 | 6.0 |
| 5 | 24.0 |
| 6 | 120.0 |
| 7 | 720.0 |
| 8 | 5040.0 |
| 9 | 40320.0 |
| 10 | 362880.0 |
先程の4の階乗の時の結果では、小数点が付いていたがscipyのintegrate関数で計算すると綺麗に小数部が0になって結果が返ってきた。
ベータ関数
2つの引数から、様々な形状の曲線を表現できる関数のこと。
ベータ関数 : \(\displaystyle B(x, y) = \int_0^1 t^{x-1} (t – t)^{y-1} dt ( \Re_x > 0, \Re_y > 0) \)
ベータ分布 : \(\displaystyle \frac{x^{\alpha – 1} (1 – x)^{\beta – 1}}{B(\alpha, \beta)} \)
ガンマ関数とベータ関数 : \(\displaystyle B(x, y) = \frac{\gamma (x) \gamma (y)}{\gamma (x + y)} \)
Pythonでベータ関数を求める
ベータ関数の\(\displaystyle \int_0^1 \)は、0~1までの間で\(\displaystyle t^{x-1} (t – t)^{y-1} \)で積分するということ。今回は積分はscipyのintegrate関数で行う。また、scipyのbeta関数でもベータ関数を実装できるので両者の結果を比較してみる。
ベータ関数 : \(\displaystyle B(x, y) = \int_0^1 t^{x-1} (t – t)^{y-1} dt ( \Re_x > 0, \Re_y > 0) \)
from scipy.special import beta
from scipy import integrate

def beta_func(x, y, t):
  # t^(x-1) * (1-t)^(y-1)
  r = t ** (x - 1) * ((1 - t) ** (y - 1))
  return r

# 積分(0~1)
result, err = integrate.quad(lambda t: beta_func(1, 5, t), 0, 1)
print(result)
print(beta(1, 5))
0.2
0.2積分を使って実装したベータ関数とscipyのベータ関数で両方とも同じ結果が出力された。
次に、下記の式のようにガンマ関数からベータ関数を再現してみる。
ガンマ関数とベータ関数 : \(\displaystyle B(x, y) = \frac{\gamma (x) \gamma (y)}{\gamma (x + y)} \)
from scipy.special import gamma

x = 1
y = 5

result = (gamma(x) * gamma(y)) / gamma(x + y)

print(result)0.2これも同じ値が出力された。
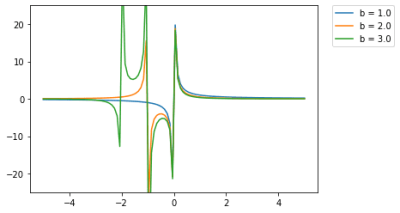
最後に、\(\displaystyle (\Re_x > 0, \Re_y > 0) \)について考えてみる。これは、引数(x, y)が0より大きい数が渡されるということ。負の数だと、ガンマ関数の時のように不規則な値が出力される。実際に、ベータ関数に負の数を入れて出力してみる。ベータ関数は、scipyのbeta関数で実装できる。
import numpy as np
from scipy.special import beta
from scipy import special

t = np.linspace(-5, 5, 100)

for i in range(1, 4):
  plt.plot(t, special.beta(t, i), label='b = {0:.1f}'.format(i))

plt.legend(bbox_to_anchor=(1.05, 1), loc=2, borderaxespad=0.)
plt.ylim((-25, 25))
このように0より左側、つまり負の数の時は出力が安定しない。

記事を読んでいただきありがとうございました。