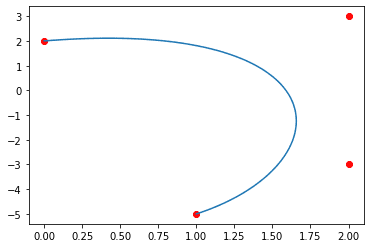
ベジェ曲線
ベジェ曲線は、どんな任意のポイントでも滑らかな曲線にします。\(\displaystyle b_i \)はベジェ曲線を描くために指定したポイントで、\(\displaystyle n \)はベジェ曲線を描くために指定したポイントの数です。また、\(\displaystyle t \)は0から1の値を取ります。
ベジェ曲線 : \(\displaystyle p(t) = \sum_{i = 0}^{n-1} b_i \begin{pmatrix} n – 1 \\ i \end{pmatrix} (1 – t)^{n – i – 1} t^i \)
二項係数は、\(\displaystyle n \)個あるものから順番を考慮せずに\(\displaystyle i \)個取った時の組み合わせです。
二項係数 : \(\displaystyle \begin{pmatrix} n \\ i \end{pmatrix} = {}_n \mathrm{ C }_i = \frac{n!}{i!(n – i)!} \)
Pythonでベジェ曲線を求める
Pythonでは階乗はmathモジュールのfactorial関数で実装できます。
import math
from matplotlib import pylab as plt

def combination(n, i):
  comb = math.factorial(n) / (math.factorial(i) * math.factorial(n - i))
  return comb

def bezier_curve(b, t):
  n = len(b)
  p = 0

  for i in range(n):
    p += b[i] * combination(n - 1, i) * ((1 - t) ** (n - i - 1)) * (t ** i)

  return p

# ポイント
point = np.array([[0, 2], [2, 3], [2, -3], [1, -5]])

x_point = list()
y_point = list()

for t in np.linspace(0, 1, 100):
    x_point.append(bezier_curve(point[:, 0], t))            # X座標
    y_point.append(bezier_curve(point[:, 1], t))            # Y座標

plt.plot(x_point, y_point)                            # 曲線
plt.scatter(x=point[:, 0], y=point[:, 1], color='r')  # 座標
plt.plot()
バラバラの座標もこのように曲線にしてくれる。
因みに二項係数はscipyのspecialのcomb関数で求めることができる。
import math
from scipy import special

def combination(n, i):
  comb = math.factorial(n) / (math.factorial(i) * math.factorial(n - i))
  return comb

n = 5
result = list()

for i in range(n):
    result.append([combination(n, i), special.comb(n, i)])

pd.DataFrame(result, columns=['combination', 'scipy'])| combination | scipy |
|---|---|
| 1.0 | 1.0 |
| 5.0 | 5.0 |
| 10.0 | 10.0 |
| 10.0 | 10.0 |
| 5.0 | 5.0 |
独自で作った二項係数の関数と同じ値が出力された。

記事を読んでいただきありがとうございました。